This is a snapshot of the software we use to collect N2O5. The data in the picture shows we are actually seeing N2O5 in the atmosphere. The blue trace decreases as the N2O5 is absorbed by the laser at 662 nanometer wavelength. The blue trace increases during the clean cycle so the cell is ready for the next measurement. It is pretty exciting when you see this modulation occur, because we know we will have data to analyze from this field study.

The profile inlet on the left in the up position and met tower with instruments on the right.

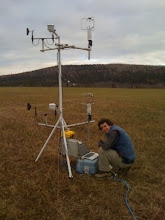
This is a picture of a PhD graduate student near the end of a great and exhausting field study!
 This is a snapshot of the software we use to collect N2O5. The data in the picture shows we are actually seeing N2O5 in the atmosphere. The blue trace decreases as the N2O5 is absorbed by the laser at 662 nanometer wavelength. The blue trace increases during the clean cycle so the cell is ready for the next measurement. It is pretty exciting when you see this modulation occur, because we know we will have data to analyze from this field study.
 The profile inlet on the left in the up position and met tower with instruments on the right.
 This is a picture of a PhD graduate student near the end of a great and exhausting field study!


No comments:
Post a Comment