Thursday, November 19, 2009
Profiler in action!
The inlet of the CRDS automatically moves up and down throughout the night to sample air at two different levels. So far, we have seen lower concentrations of N2O5 at the lower level. This suggests N2O5 is being deposited to the snowpack. This data, coupled with vertical wind speeds, can be used to calculate a flux, or deposition rate, to the snowpack.
Tuesday, November 17, 2009
New Snow and Cold Temps
 Patrick downloading met tower data at -20F. Currently we have low temperatures and a very stable atmosphere. We are not seeing N2O5 because there are high amounts of NO (nitric oxide). When NO is present in the atmosphere it reacts with NO3 (nitrate radical) in the following reaction:
NO + NO3 --> 2NO2
This previous reaction is fast and NO3 does not exist to even form N2O5(NO2+NO3<-->N2O5).
Making Progress
 This is a snapshot of the software we use to collect N2O5. The data in the picture shows we are actually seeing N2O5 in the atmosphere. The blue trace decreases as the N2O5 is absorbed by the laser at 662 nanometer wavelength. The blue trace increases during the clean cycle so the cell is ready for the next measurement. It is pretty exciting when you see this modulation occur, because we know we will have data to analyze from this field study.
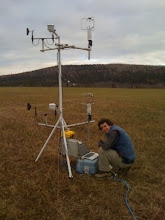
 The profile inlet on the left in the up position and met tower with instruments on the right.
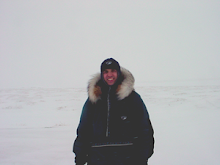
 This is a picture of a PhD graduate student near the end of a great and exhausting field study!
Thursday, November 5, 2009
The profiler
 The profiler is on the gray tripod to the left in the picture. The profiler consists of a long bike chain, two gears and a stepper motor to control the movement of the inlet. The profiler raises and lowers our air sampling inlet to the heights of the met tower instruments. The automated inlet allows us to sample at each level every two minutes. The inlet samples air for the N2O5 instrument, NOx and Ozone.
Sunday, November 1, 2009
The inside of the hut and the instruments
 The inside of the hut contains all of the instruments that measure NOx (NO + NO2), ozone ( O3) and N2O5.
 This is the instrument that measures N2O5. It was developed in our lab by Bill Simpson and other graduate students. It uses a technique called Cavity Ring Down Spectroscopy (CRDS). The instrument has a diode laser at 662 nanometer wavelength(red). The laser light enters the cavity and reflects off the two mirrors; one at each end. The light "rings down" similar to a bell and that time is measured. When there is N2O5 present it absorbs at 662 nanometers and the ringdown time is less. We are able to measure the amount, or mixing ratio, of N2O5 in the atmosphere in pptv (parts per trillion by volume) from the difference in these two ring down times.
Snow at the field site
 The hut is now moved out into it's final position the field next to the met tower. We have all of our instruments moved into the hut and they are now collecting data.
Friday, October 23, 2009
Met tower set-up

The meteorological tower (aka "met tower") is set up to hold the instruments that monitor weather, and will later hold the inlet for the instrument that measures N2O5. In order to completely understand the lifetimes and cycles of N2O5, we need to monitor air temperature and wind speeds. Temperature will affect the rate of chemical reactions happening in the air, while wind speeds and directions will dictate the source of our air flow.

The tower consists of two identical levels, each at different heights. In the photo above, each level holds a wind vane (black), cup anemometer (black), sonic anemometer (silver), and temperature probe (white cylinder). Sonic anemometers use sound waves to measure wind speeds in all three dimensions, while the cup anemometers catch the air like ice cream scoops and spin relative to wind speed.
 Typical nighttime wind flow at the Quist Farm site is from the northeast (~45 degrees). This typically occurs as a "drainage flow" from the city area of Fairbanks. Cold air is more dense than warm air, and will flow like water through terrain. The Quist Farm sits just downstream of Fairbanks in a valley. As cold air drains from the city at night it generates this general flow pattern. The above graph was made using the cup anemometer and wind vane data from the upper wind vane. It shows drainage flow on the night of 10/21/09. Keep in mind we use UTC standard time, so everything is synchronized. Therefore, 6AM on Oct. 22 (UTC standard) corresponds to 10PM on Oct. 21 (AK daylight).
Saturday, October 17, 2009
Quist Farm Field Site
 GPS exact location of Field Site: N64 45.558 W148 06.371 543 ft
 Our sub-Arctic field site is 20miles NNE of Fairbanks. We tracked our route out to the field site and the exact location. To identify the main wind flow direction and speed we used previous data to choose the location. Once we learned the primary wind direction was NNE from 0 to 90 degrees we choose this spot in the following video. The key characteristics of this site for the meteorology of this study are:
1- Unobstructed path of wind flow in the NNE direction.
2- Flat undisturbed field with wind direction and flow coming from downtown Fairbanks (NNE of site).
This video shows the initial visit to the Quist Farm site. In order to avoid car traffic on this road, and obstruction in the path of the main wind direction NNE, we decided to use the Hut out in the middle of the field on a flat part of the land. We ran power from the post in the end of the video out to the final position of the Hut through conduit pipe that runs underneath the driveway. Pictures of the final position for the instruments will follow in upcoming posts.
Start of our Fall 2009 Field study: the hut
 Patrick and Ben helped load the cold winter research hut up on the trailer using a ratchet system. We work with CRREL (Cold Regions Research and Engineering Laboratory) on Ft. Wainwright to obtain several key instruments and equipment for this project. Tom Douglas and Art Gelvin were instrumental to the field campaign by letting us use their meteorological tower and hut. We thank them for helping us with this project.
Subscribe to:
Comments (Atom)